Learning Something New: EDA on Guitars

Today’s post is inspired by my childhood dream of learning to play the guitar. For years, I’d daydream about strumming chords and creating melodies, but it always felt like something I’d do “someday.”
That day finally arrived when I jokingly shared this dream aloud, and my dad decided it was time to make it a reality.
Yesterday, he surprised me with my first guitar—a sleek, acoustic guitar with nylon strings.
The moment I picked it up, I was both excited and intimidated.
I immediately started tuning it and spent an hour practicing E-minor and A-minor chords.
My fingers quickly grew sore, and faint ridges were left behind from pressing on the strings—but I didn’t mind.
There was something unexpectedly soothing about the vibration of the strings resonating through the guitar, as if the instrument itself was encouraging me to keep going.
Learning a new skill is a reminder of how persistence pays off. I know that mastering the guitar will take time and consistent practice, so I’ve set myself a small, achievable goal: 20 minutes of practice every day.
Just as with the guitar, staying sharp in my field requires ongoing learning and practice. To challenge myself further, I decided to explore a dataset related to something I’ve always loved—guitars.
I immediately started tuning it and practicing the E-minor and A-minor chords, spending just over an hour at it.
In the rest of this post, I’ll walk you through how I explored this dataset. Maybe you can try replicating these steps with a dataset related to one of your own passions. Let’s dive in!
Step 1: Get to Know Your Data
Step 2: Ask Questions About Each Column
- What values are present in each column? Do they match what I expect?
- What are the maximum and minimum values in the numeric columns?
- Which columns have missing values, and how should I handle them?
- Are there any outliers or anomalies in the data?
- What features of a guitar (e.g., material, brand) are most common?
Step 3: Answer Your Questions

1) Who are the major guitar makers?
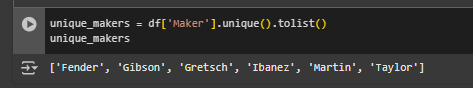 |
These brands have long-standing histories in the guitar world and are recognized as industry leaders. |
2) What is the first guitar model?
 |
I learned that the Martin 000-18 is considered one of the earliest iconic acoustic guitars. Its design and tone have inspired countless musicians over the decades. |
3) What are the top features of a guitars in this dataset?
 |
Fun Fact: Solid Sitka Spruce is known for its excellent tonal qualities, offering a bright, clear, and balanced sound. |
Step 4: Visualize Where Possible
 |
In this dataset, a small number of guitar models are no longer produced. |
If you’re working with your own dataset, I recommend starting with simple charts to get a feel for the data, then iterating as needed to highlight specific trends or anomalies.


.png)


Comments
Post a Comment